PHP and Yii with XDebug
Updated on 03 Oct 2020
We can combine xdebug with a VS code extension
Configuration - VS code
We need to install the PHP Debug extension. Once done we can click on the Bug icon in the action panel and then the config wheel.
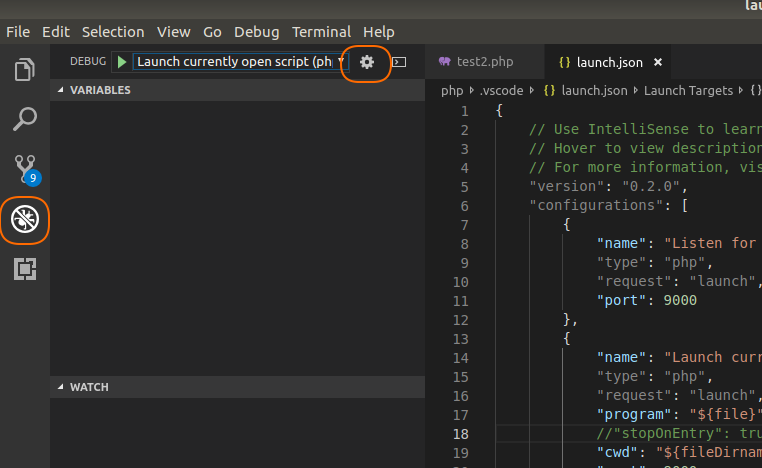
This will create a config file, and we want it to look something like this:
{
    // Use IntelliSense to learn about possible attributes.
    // Hover to view descriptions of existing attributes.
    // For more information, visit: https://go.microsoft.com/fwlink/?linkid=830387
    "version": "0.2.0",
    "configurations": [
        {
            "name": "Listen for XDebug",
            "type": "php",
            "request": "launch",
            "port": 9000
        },
        {
            "name": "Launch currently open script",
            "type": "php",
            "request": "launch",
            "program": "${file}",
            //"stopOnEntry": true,
            "cwd": "${fileDirname}",
            "port": 9000
        }
    ]
}
The stopOnEntry parameter defaults to false and can be used to enter the debug mode at the very start of the script.
Changes for Version 3
In version 3, the default port for XDebug in the CLI is 9003. Make sure in the above settings for the "Launch currently open script" we set the port value to 9003. At the moment I have found that the wed debugger still works on port 9000.
{
    // Use IntelliSense to learn about possible attributes.
    // Hover to view descriptions of existing attributes.
    // For more information, visit: https://go.microsoft.com/fwlink/?linkid=830387
    "version": "0.2.0",
    "configurations": [
        {
            "name": "Listen for XDebug",
            "type": "php",
            "request": "launch",
            "port": 9000
        },
        {
            "name": "Launch currently open script",
            "type": "php",
            "request": "launch",
            "program": "${file}",
            //"stopOnEntry": true,
            "cwd": "${fileDirname}",
            "port": 9003
        }
    ]
}
PHP Commandline
To run our PHP script thru the debugger requires the following:
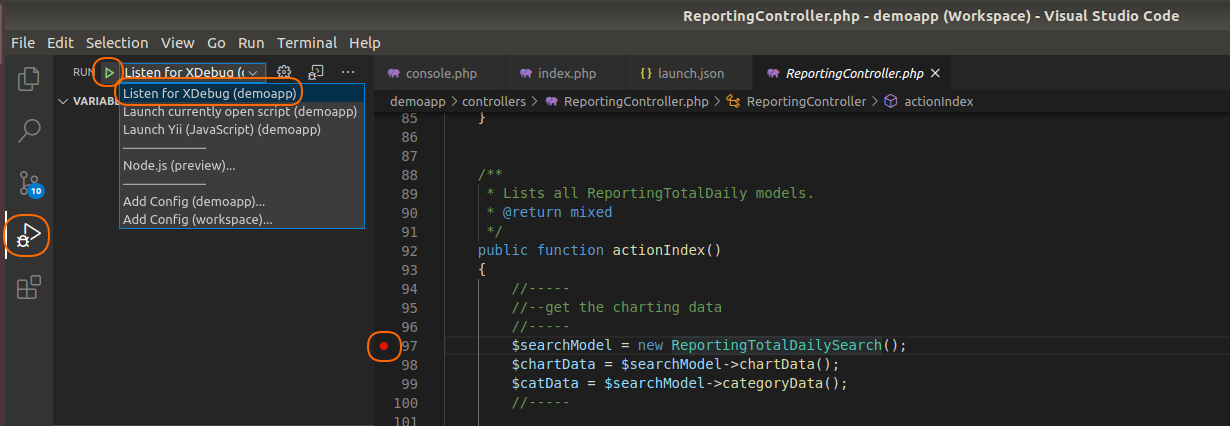
- Select some breakpoints in your code (click just to the left of the line number to add a breakpoint)
- Click on the
bugin the action panel - Select the config you want to run
Launch currently open script - Click the green run icon
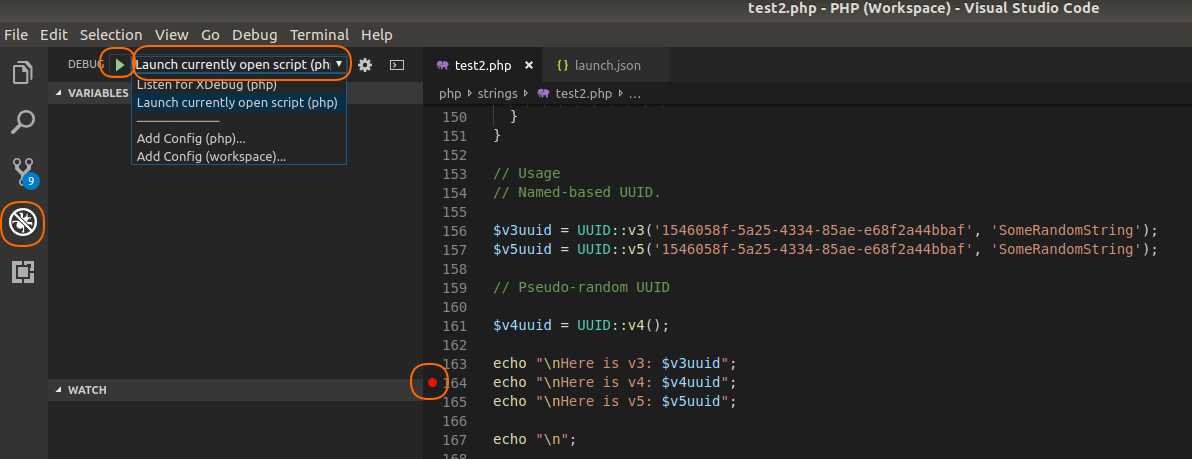
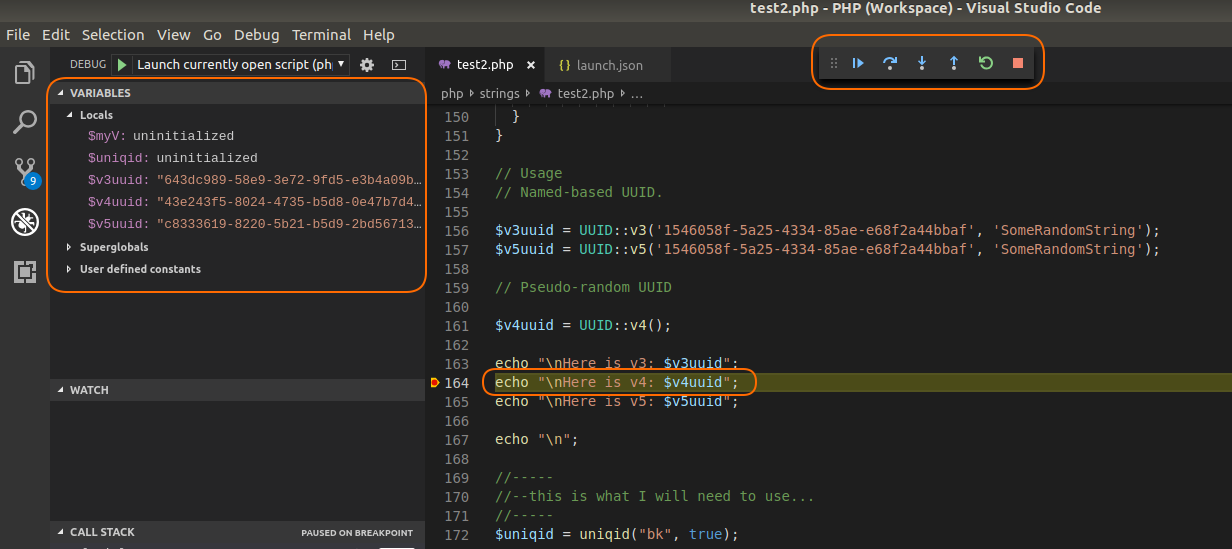
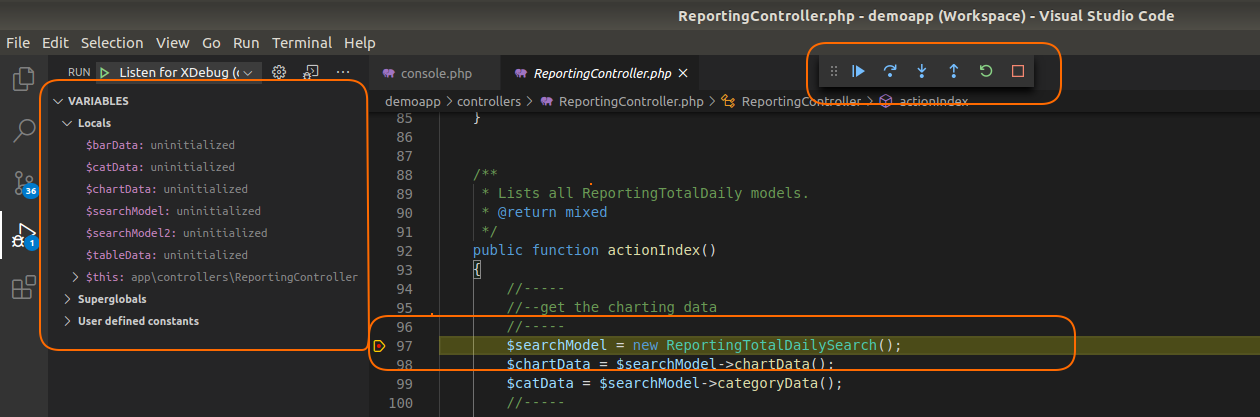
Your code will now run in the debug console window at the bottom, and will stop/pause at the breakpoint. We will be able to step-over the code and follow thru each line statement.
PHP Commandline - Version 3
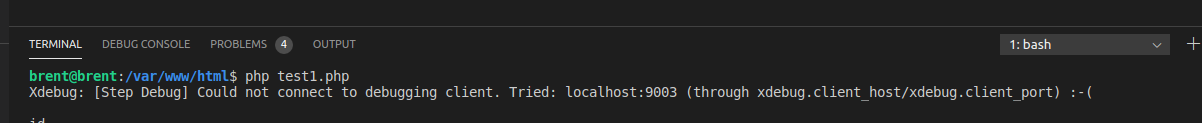
Exactly the same as the previous section to run your code thru the debugger. However an issue that hasn’t been resolved (and one that I haven’t figured out a solution to yet) is that you will get an xdebug error message if you try to run your code normally thru the CLI. No amount of playing around with log files, log levels and google searches seems to resolve this issue.
Xdebug: [Step Debug] Could not connect to debugging client. Tried: localhost:9003 (through xdebug.client_host/xdebug.client_port) :-(
Yii Debugging - web application
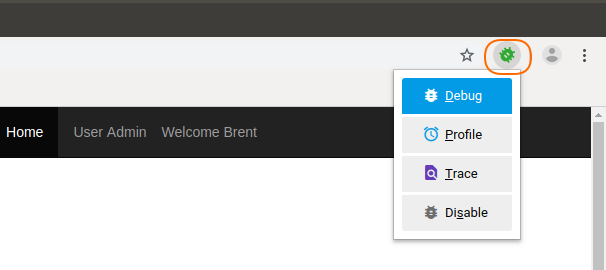
We can also debug Yii applications in a similar fashion. In Chromium we need to install an extension xdebug helper. This will provide a little icon on the menu bar which we need to select when we are ready for debugging.
- Open your Yii application in VS Code and select a couple of breakpoints.
- Click on the
bugin the action panel - Select
Listen for XDebugfor the configuration - Click the green run icon
- In Chromium make sure your bug is enabled for debug
Note: There is an option to
Launch Yii, however this is only for debugging Javascript
Your code will now run in the debugger and break-out to the debugger at the breakpoint. We will be able to step-over the code and follow thru each line statement and inspect the variables.
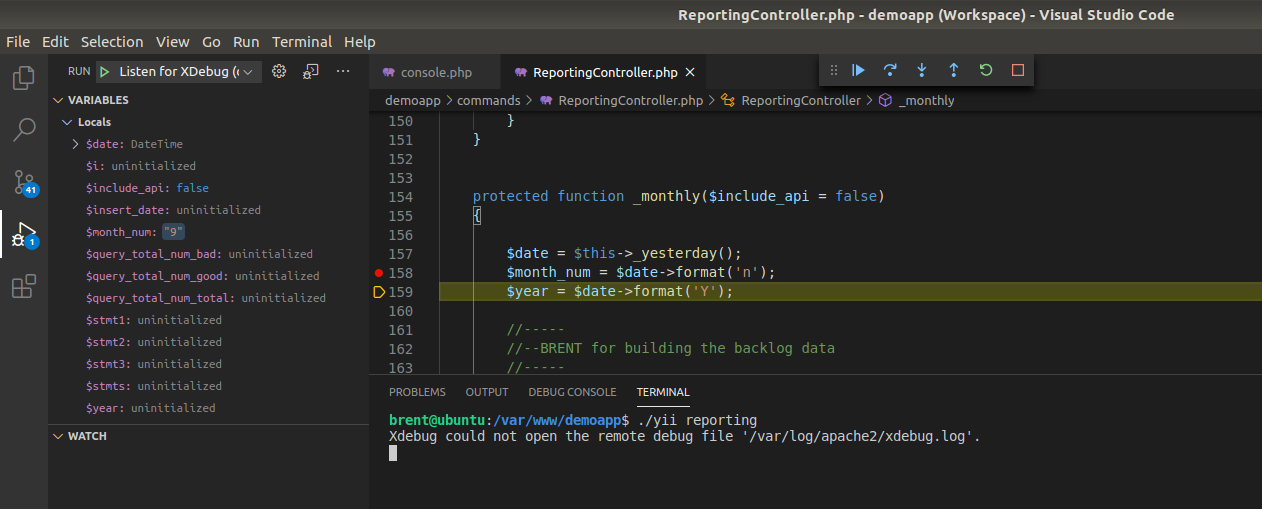
Yii Debugging - console command
We can also debug Yii console commands in exactly the same way as the web version.
- Open your Yii application in VS Code and select a couple of breakpoints.
- Click on the
bugin the action panel - Select
Listen for XDebugfor the configuration - Click the green run icon
- In the terminal (or separate command window) run your Yii command.
Example
./yii reporting